vRealize Operations Manager (vROps) Troubleshooting – Lesson Learned
As I was recently delivering a VMware Professional Services engagement, I learned a valuable lesson concerning VMware vRealize Operations Manager (vROps). I should use vROps to troubleshoot vROps!
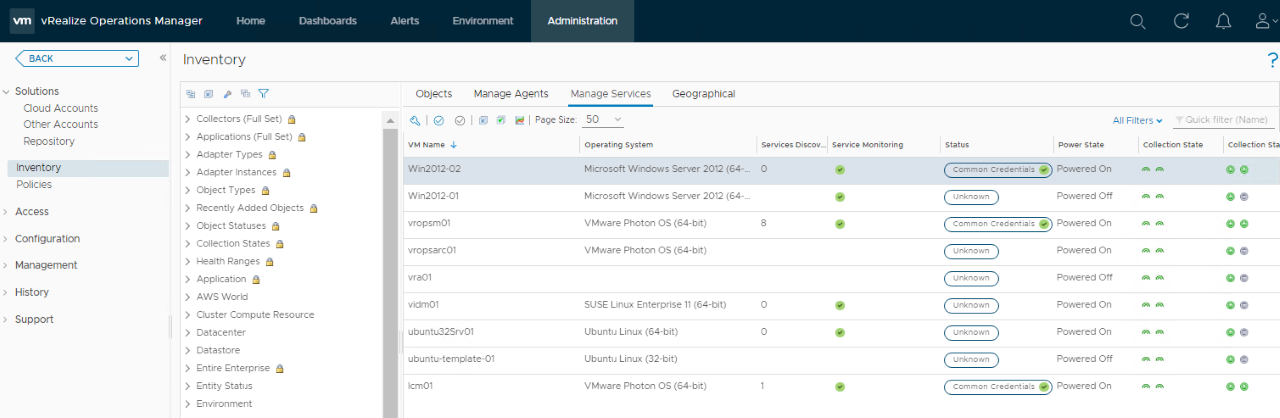
During my effort to enable a new vROps customer to successfully utilize the software to monitor, analyze, and troubleshoot their business application workloads and infrastructure, I missed the opportunity to use vROps to solve an issue with vROps. After covering how to use vROps features, such as monitoring, optimization, resource reclamation, and compliance, we ran into issues activating the vRealize Application Monitoring management pack and using the activated Service Discovery Management Pack. We successfully enabled Service Discovery on the vCenter Server adapter, but the Manage Services page did not populate as expected. We expected the Manage Services page to display all the underlying VMs, including those where service monitoring is not yet working due to issues such as wrong credentials or VMware Tools version, as you see in this example from my (MEJEER, LLC) lab environment.
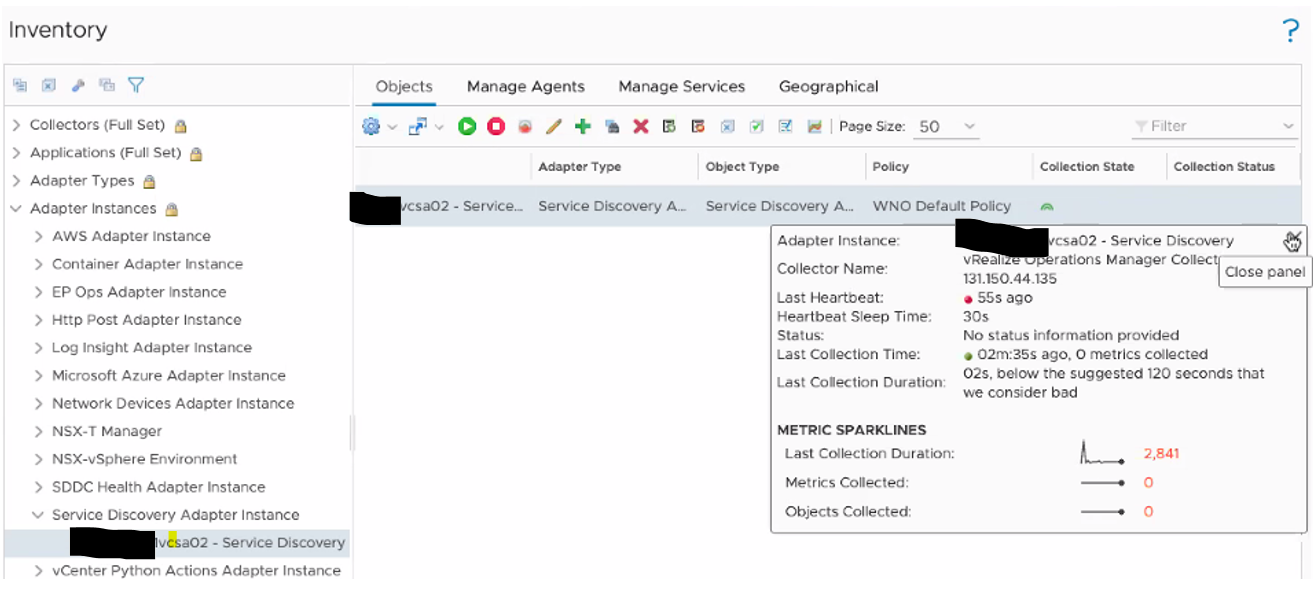
Instead, the rows in the Manage Services table were empty. Additionally, the Service Discovery Adapter instance indicated the number of Objects Collected was zero, as shown here.
We expected the issue to be related to the error we received when attempting to install the vRealize Orchestrator management pack and the issue we encountered when attempting to activate the vRealize Application Monitoring management pack. Immediately, we started examining log files and other brute force efforts.
If we had simply looked in vROps for any alerts related to the vROps node (virtual appliance), we would have discovered an alert for guest file system usage and would have quickly identified the root cause and solution. Specifically, the out-of-the-box alert named One or more guest file systems of the virtual machine are running out of disk space was triggered days earlier, but had gone unnoticed because the (test) environment had many alerts
In the Service Discover adapter instance’s log file, we saw an error writing a file.
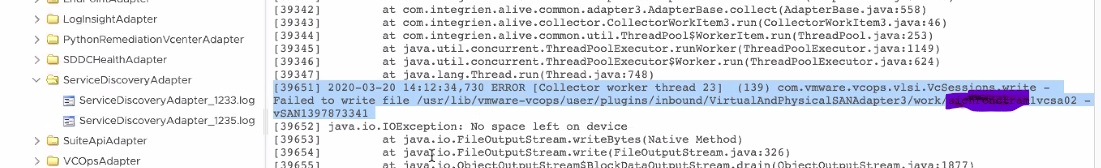
We analyzed the error and discovered the root partition in the vROps node was 100% full. The time spent from the moment we began reviewing logs until we discovered the filled root partition was about one hour. If we had simply looked at the vROps alerts, we could have discovered the filled root partition within minutes.
In my defense, the environment was new and was being used for proof of concept and user enablement. We added an endpoint to collect data from an old vSphere environment, which triggered hundreds of out of the box vROps alerts. (The customer intends to address all of the alerts in time.) So we were ignoring alerts while I provided informal hands-on training to the customer. I planned to guide the customer with creating a dashboard that provides a single-pane of glass for observing the health, alerts, performance, and risk of their management cluster, including the vROps nodes. If the vROps issue occurred after the engagement, the customer likely would have proactively caught it prior to the root partition reach 100% full (while the alert was at the warning level).
In case you are wondering, the root cause of the error was due to a known issue in vROps 8.0 that was fixed in a later version. The error is described in VMware KB 76154. The fix is to restart the rsyslog service (service rsyslog restart).
NOTE: We learned that if we caught the issue before the root partition filled, we may have been able to fix the problem by restarting the vROps appliance. BUT, if we restarted the vROps appliance after the root partition filled, it would have put the appliance in very bad state and required us to open a VMware Service Request.