Examining Health of a vRA 7.x Instance
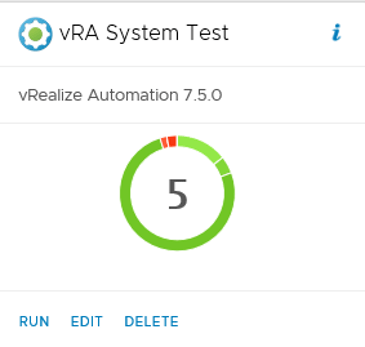
Your vRA 7.x instance can be configured to run System Tests daily. You can navigate to Administration > Health to view details of the most recent system test. In this example, five tests failed during the last run.

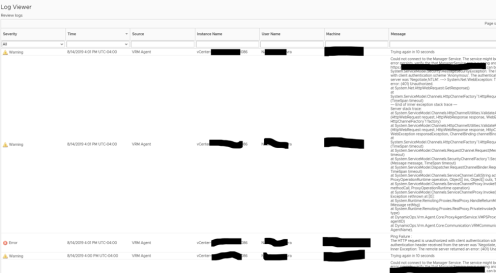
To troubleshoot specific issues or to just learn more about vRA health, you can examine its logs. Navigate to Infrastructure > Log

In this example, warnings and errors are occurring every minute.
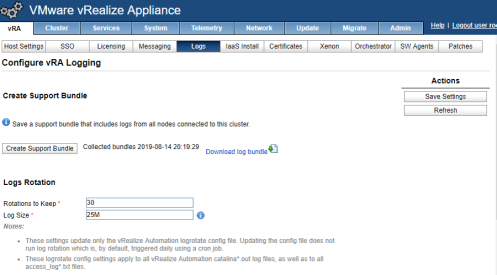
Prior to opening a vRA ticket with VMware Support, you should generate a support bundle that you can upload to VMware. Use the VAMI (https://vRA-node-FQDN:5480) and navigate to Logs. Click the Create Support Bundle button.
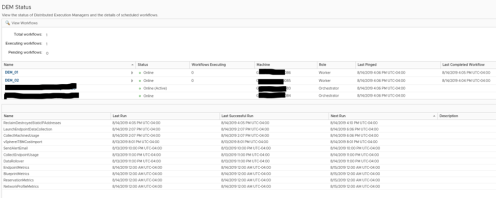
Back on the Infrastructure page, just above the Log option, you can select the DEM Status option to verify that the DEMs are running. In this example, both DEMs are Online.
You can use SSH (Putty) to logon to a vRA appliance using the root account. Here you can run this command:
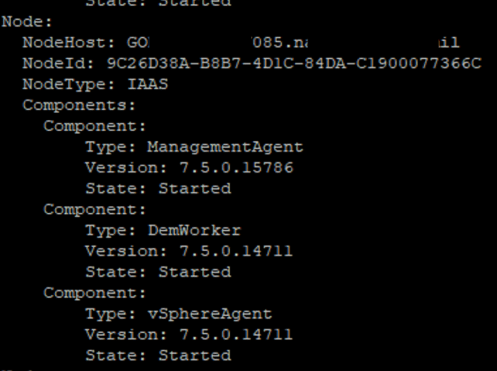
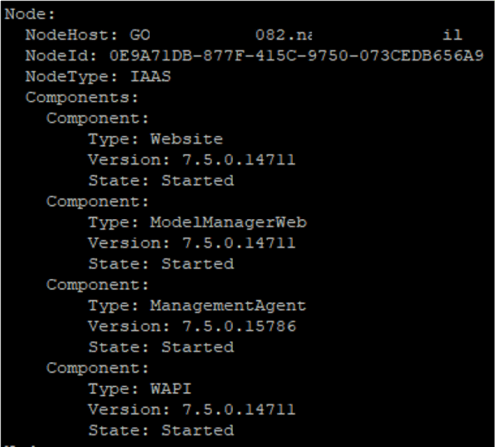
vra-command list-nodes –components
This produces a lot of results about the health of each node. You should run this command and capture its results when everything is healthy in your environment. You can use the results as a baseline for comparison during times of health concerns.
Here are example screenshots from a recent execution in a healthy environment. The full results of the command are captured as separate screenshots and organized here by node type with some explanation. In this example, we refer to each node’s name by a number, which is part of the node’s full name that is masked in the screenshot.
vRA appliances (nodes 41, 42, 43). In this example, node 42 is currently the Master node, as indicated by the fact that its value for Primary is true.


IaaS Web Server Nodes (81 and 82). Notice two components (Database and ModelManagerData) that appear for Node 81 do not appear for Node 82.

IaaS Server Nodes (83 and 84). Notice in this example, that Node 84 is the Active node and Node 83 is the Passive node.


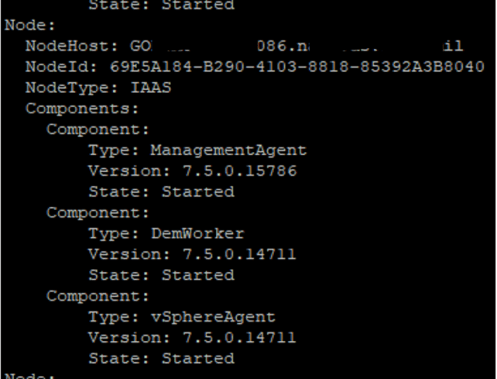
DEM / Agent nodes (85 and 86).